Loading...
21st October 2016

This is a two-part investment letter. Part I offers a few thoughts on selecting the right investment objective while Part II, to be published next week, looks at selecting the right assets to achieve that objective. To receive it directly please email info@equitile.com with ‘Subscribe’ in the subject header.

Selecting the right investment objective
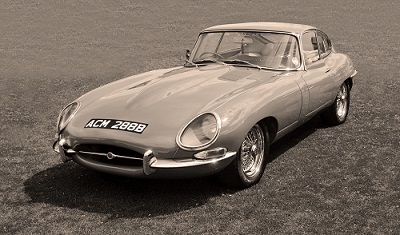
The Sixties started swinging for real in 1961: that was the year the birth control pill became available on the British National Health Service (sex); The Avengers launched on TV with a story of heroin dealing in London (drugs); and Elvis Presley had a hit with ‘Can’t Help Falling in Love’ (rock’n’roll). Hedonism was back in fashion and in 1961 there was no more hedonistic product than the new, breathtakingly pretty, E-Type Jaguar, described by Enzo Ferrari as the most beautiful car he had ever seen.
The list price of a 1961 E-Type was £1,954, a small fortune at the time. To put that price into context, in Britain average annual earnings then were just £562* and a typical house cost around £2,403*. So the original E-Type cost approximately 3.5 years’ income or roughly 80% of the price of a house. The hedonism of owning the most beautiful car in the world did not come cheap.
Today, a little more than half a century later, prices have changed dramatically, in both absolute and relative terms. The average income in the UK is now around £25,600*, a 45.5-fold increase since 1961. The list price of the F-Type Jaguar, the E-Type’s more technically able but much less aesthetically pleasing descendant, is now £51,775, a 26.5-fold increase. And the average UK house now costs about £198,564*, a staggering 82.5-fold increase on the 1961 price.
Since 1961 the price of a Jaguar sports car has fallen from 3.5 years’ income to just 2 years’ income, while house prices have risen from 4.25 years’ income to an eye-watering 7.75 years’ today.
Interestingly official inflation statistics report only a 20-fold* increase in prices since 1961, significantly below the E-Type to F-Type inflation rate and dramatically below the rate of house price inflation. There are a number of reasons for this lower reported rate of inflation. Firstly, inflation measures the changing prices of goods and services rather than the changing prices of assets. Secondly, inflation statistics are corrected for the changing basket of goods and services we buy and for the improvements in their quality. (We may write on the problem of ignoring asset price inflation in a later letter, but for now it’s the significance of these quality adjustments we want to focus on.)
Inflation statistics are trying to measure how prices change over time. To do this they must be able to compare purchase prices at different times on a like-for-like basis. This is a difficult task because our consumption patterns and the nature of the products we consume are constantly changing – usually the quality of the products is getting better over time.
Today’s F-Type Jaguar is unequivocally a better vehicle than the 1961 E-Type. It is faster, stronger, more reliable, safer and better equipped. It is argued that today’s F-Type buyer gets more car for their money than an original E-Type buyer so therefore the inflation statistics should be corrected downwards to record a lower than 26.5-fold increase in the price of Jaguar sports cars since 1961.
Economists sometimes refer to these downward adjustments to their inflation statistics as ‘hedonic adjustments’:
Hedonic quality adjustment is one of the techniques the CPI uses to account for changing product quality within some CPI item samples. Hedonic quality adjustment refers to a method of adjusting prices whenever the characteristics of the products included in the CPI change due to innovation or the introduction of completely new products.
The use of the word “hedonic” to describe this technique stems from the word’s Greek origin meaning “of or related to pleasure”. Economists approximate pleasure to the idea of utility – a measure of relative satisfaction from consumption of goods. In price index methodology, hedonic quality adjustment has come to mean the practice of decomposing an item into its constituent characteristics, obtaining estimates of the value of the utility derived from each characteristic, and using those value estimates to adjust prices when the quality of a good changes**.
The logic of these adjustments is simple enough. The F-Type Jaguar is a better quality car than the original E-Type. Therefore, the F-Type provides today’s owner with greater utility or hedonism than the E-Type did for its owner in 1961.
The F-type is certainly a better car but does it really provide more utility? It is worth pausing for a moment to imagine our two car purchasers taking delivery of their new automobiles. Is it reasonable to assume the owner of a new F-Type Jaguar today is really in a greater state of rapture than the owner of a new E-Type was back in 1961?
Products may be better today than they were then, but is there really more hedonism today than in the Swinging Sixties with its sex, drugs and rock’n’roll?
Put differently, does the utility we gain from our consumption rise over time to reflect the improving quality of products we buy, or do we adapt our expectations to the current environment, so that our utility remains more or less constant over time? Surprising as it may sound, the answer to this esoteric question could be very important for investors. It could help us measure investment success better and help us understand the type of assets in which we need to invest, in order to achieve success.
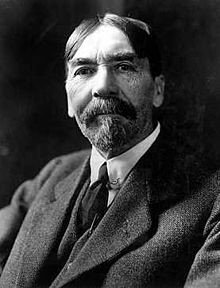
The Norwegian-American economist Thorstein Veblen (1857-1929) is one of our favourite economic thinkers. Veblen coined the term ‘conspicuous consumption’ to explain an important aspect of human nature.

Veblen understood that once we move beyond a basic subsistence-level of consumption, consumption becomes increasingly a competitive activity. Veblen recognised that much of our consumption is driven by our desire to signal our position within the social pyramid: we don’t buy sports cars to drive fast, we buy them to show we can buy them. By Veblen’s logic the utility of a sports car is not derived from its technical qualities but rather from the combination of its ferociously high price together with its ostentatious impracticality.
Veblen’s ‘conspicuous consumption’ was just another way of explaining an aspect of human nature which we all instinctively understand: ‘keeping up with the Joneses’ is a real human ‘need’.
But Veblen’s insight presents an intriguing challenge to the rationale of hedonically adjusting our inflation data. Economists think today’s F-Type Jaguar provides more hedonism than the inferior 1961 E-Type, but the E-Type cost 3.5 years of income whereas today’s F-Type costs only 2 years of income. Today’s F-Type may be a better vehicle but, as a Veblen good, yesterday’s E-Type was the superior product, providing its owner with more status. In the context of its time, the E-Type Jaguar was more special in 1961 than the F-type Jaguar is today. By this logic, sports cars and most other goods may be rising in quality but perversely their hedonically adjusted value is declining.
This brings us to a simple but important distinction between what economists are trying to measure with their inflation statistics and what investors need to achieve with their investment returns. Inflation statistics attempt to measure what yesterday’s basket of goods and services will cost at today’s prices. But investors need to be able to afford tomorrow’s goods and services at tomorrow’s prices. In essence, inflation statistics tell us how much money we need to keep up with the spending pattern of our parents, but investors need to keep up with the spending pattern of their peers.
The distinction between keeping up with our parents and keeping up with our peers is important. Recall, since 1961 prices have risen 20-fold, whereas income and therefore expenditure has risen 45.5-fold.
Since that year, keeping pace with the spending of our parents (price inflation) would have required an average annual investment return of 5.7% but keeping up with the spending power of our peers (income inflation) would have required an average return of 7.3% per year. An investment whose value kept pace with the value of reported inflation would have fallen far behind the level of spending of society as a whole, leaving its owner feeling relatively poorer.
If we accept that keeping up with the Joneses is a real human ‘need’ then, keeping up with quality-adjusted inflation is not good enough: it is necessary to keep up with income growth. For this reason, we believe a reasonable long-term investment objective is to aim to generate returns that at least meet or preferably beat the rate of income growth. Investors who achieve this goal will likely feel broadly satisfied with their results over time. Conversely investors whose returns fall short of income growth are likely to feel dissatisfied with their returns.
For this reason, we suggest adopting income growth as a reasonable measure of investment success. Which begs the question: how should we invest to generate returns that meet or beat income growth? This will be the topic of the next investment letter.
George Cooper, Chief Investment Officer Equitile Investments Ltd.
October 2016.
1: *MeasuringWorth.com, 1961 UK Average Annual Nominal Earnings £562
2: *Nationwide UK House Price Survey, All Houses, Q1 1961
3: *MeasuringWorth.com, 2015 UK Average Annual Nominal Earnings £25,609
4: *Nationwide UK House Price Survey, All Houses, Q1 2016 £198,564
5: *MeasuringWorth.com 1961 inflation index = 5.76, 2015 inflation index 115.63
6: **US Bureau of Labor Statistics https://www.bls.gov/cpi/cpihqaqanda.htm