
Loading...
29th June 2021

We have written a great deal over the last few years on the wealth polarising effect of monetisation. Given the significant increase in the Federal Reserve’s balance sheet through the COVID19 lockdowns, therefore, it should come as no surprise that the portion of net worth owned by America’s wealthy has increased again – nearly a third of all net worth in the US is in the hands of the Top 1% (see figure 1).
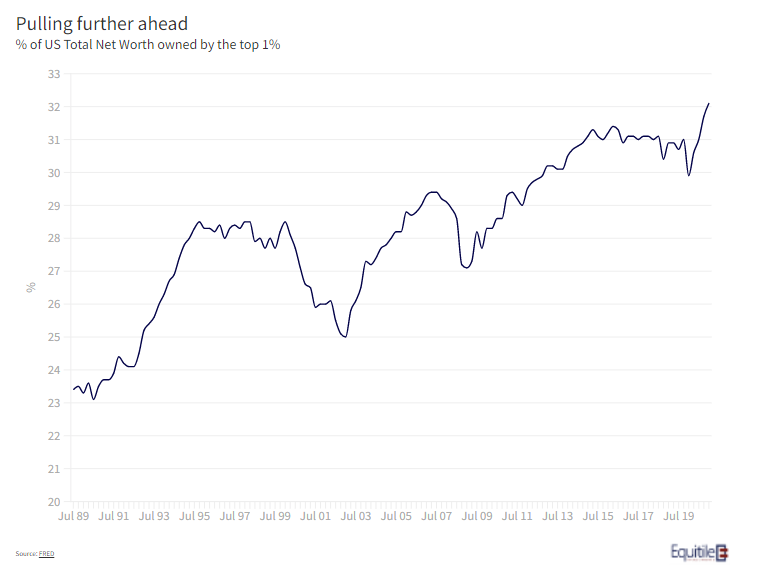
The most often cited cause of this is the Fed’s impact (although they largely deny this) on the price of assets held mainly by the well-off. There are, however, more subtle drivers too. The swings seen in asset markets, due to both COVID in 2020, and the longer-term effect rising leverage has on market volatility, has made it more difficult for the less-well off to hold on. In a bear market, as John Pierpont Morgan somewhat cynically pointed out, “stocks return to their rightful owners” and so if bear markets come more often and more sharply, then the rate of repatriation will only accelerate.
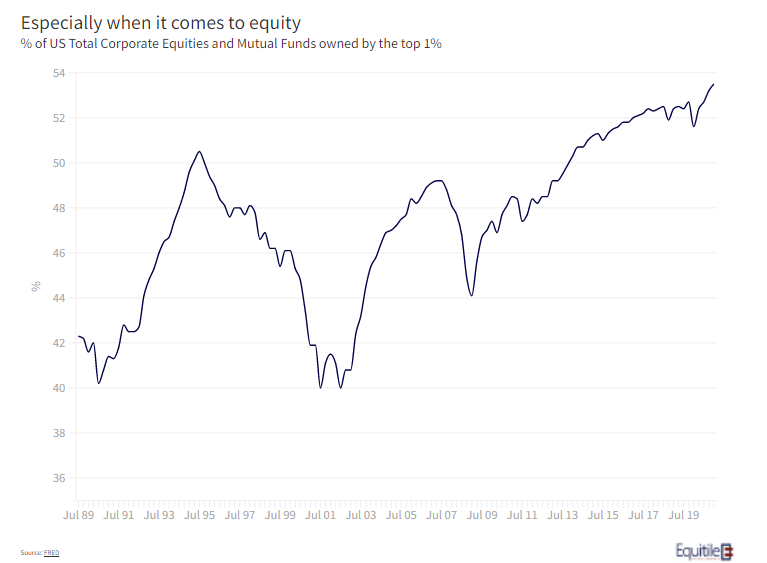
This might explain why, as shown in figure 2, the ownership of corporate equities and mutual funds in the US has become even more concentrated than for other forms of wealth. More than a half of all business equity, held either directly or indirectly, is held by the top one per cent of all owners. A trend that looks set to accelerate.
It may not only come down to the capacity to sustain losses, however. As in all western countries, good advice comes at a price. At Equitile we are not financial advisers but we talk to many advisers through the course of our business. As we see it, the crucial value of a good adviser is support and encouragement when the market has a set-back. A good adviser is in the best position to help investors overcome their natural behavioural aversion to loss, and to help plan their broader finances to make this easier. With good personal advice now scarce and expensive for those of lesser means, the ability to sustain losses floats ever upwards.
One intriguing move by the top 1% is their move away from bonds. Their holdings of debt assets (figure 3) has fallen from more than 60% to 40% of all debt assets in the last two decade - they sold aggressively throughout the COVID crisis.
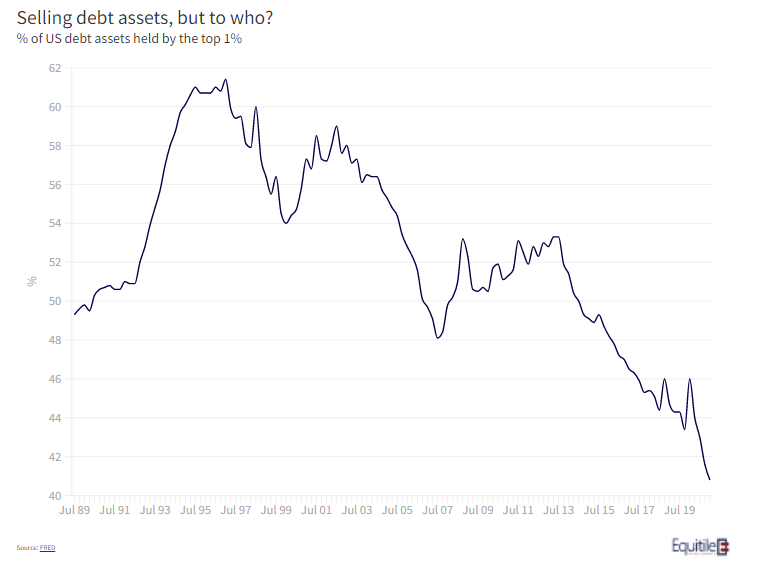
With real interest rates in the US the most negative since the 1970’s, the potential for capital destruction through financial repression, for bond holders at least, is rising sharply. Perhaps the top 1% know this instinctively, or perhaps they are just better advised.
18th March 2021

Yesterday’s FOMC statement is important (March 17th 2021).
There are three points worthy of note:
1: “the Committee will aim to achieve inflation moderately above 2 percent for some time so that inflation averages 2 percent over time”
This is a commitment to the ‘make up strategy’ whereby the Fed seeks to achieve higher future inflation to make up for previously having failed to achieve its desired 2% inflation target. From the FOMC’s perspective, this narrative provides the flexibility keep interest rates extremely low even if it becomes manifestly clear it is failing to maintain inflation at or below its 2% target. This is, as explained by the following passage, now the FOMC’s goal:
2: The Committee decided to keep the target range for the federal funds rate at 0 to 1/4 percent and expects it will be appropriate to maintain this target range until labor market conditions have reached levels consistent with the Committee's assessments of maximum employment and inflation has risen to 2 percent and is on track to moderately exceed 2 percent for some time.
The FOMC’s goal is first to achieve a negative real interest rate of at least 2% and then to maintain that negative interest rate for ‘some time’. In other words, the FOMC would like to see the spending power of money, saved in the government bond markets, falling by at least 2% per year for the foreseeable future. In order to achieve this the committee is making an open-ended and asymmetric commitment to balance sheet expansion, arguably a euphemism for debt monetization:
3: Federal Reserve will continue to increase its holdings of Treasury securities by at least $80 billion per month and of agency mortgage backed securities by at least $40 billion per month until substantial further progress has been made toward the Committee's maximum employment and price stability goals.
In our view, FOMC is being both honest and pragmatic, effectively admitting the cost of the economic lockdown policies of 2020 and 2021 can only be funded through the printing press. As a result, we believe we are already in the early stages of an uptrend in inflation which will likely last several decades.
We expect the inflation trend to be maintained and accelerated through monetary and fiscal policy coordination; governments will continue spending far beyond their means and central banks will continue ‘footing the bill’ with monetization and negative real interest rates. If so, the global government bond markets will cease to be a viable long-term savings vehicle for the private sector.
6th July 2020

As pubs and restaurants opened in the UK last weekend, we’ve heard mixed reports on how many customers returned. Either way, it doesn’t look like there was a mad rush back.
Most likely, they’ll see a repeat of the retail sector’s experience over the three weeks after they were allowed to open - things have picked up but not by much. Data from Springboard shows footfall in the high street is still less than 40% of what it was at the beginning of March. Retail parks are faring better but are still only seeing around 70% of the footfall they were before lockdown.
In George’s recent COVID-19 Insights piece he talked about the likely bifurcation in the fortunes of the very large companies and small ones, particularly in retail, hospitality and travel. It seems that his projection is playing out.
The Bank of England reported last week that, while SME’s had increased their net borrowing in May by £18.2 billion, large ones had paid off £12.9 billion of debt.
A recent ONS survey analysing the impact of COVID-19 paints a similar picture with the financial resilience of many small companies now being seriously tested. Of the 5,600 or so companies which responded, 14% were still not trading by mid-June. Of the 86% that were trading, 18% of their staff were still furloughed.
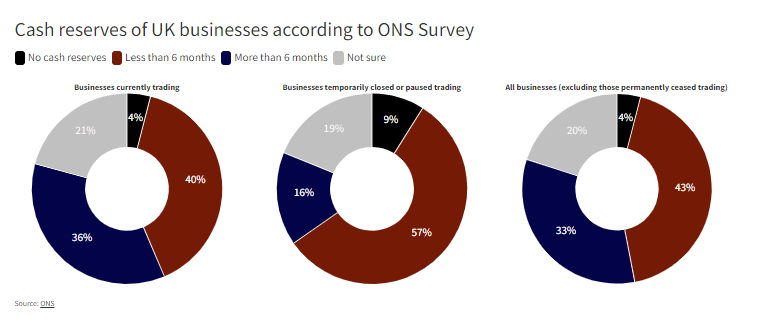
More worrying was companies’ assessment of their financial resilience. Of those businesses actually trading in mid-June, 44% said they have cash reserves to last less than six months. Including business that were still closed, close to half said they can’t survive more than six months given their current cash reserves.
The economy needs to pick up much more quickly if many of the UK’s smaller enterprises are to survive.
2nd July 2020

It doesn’t look like the permitted re-opening of retail stores in the UK has marked a rush back to the shops. One might have expected people to be cautious in the first week or so but even in week two the footfall in England and Northern Ireland was still down 53.1% on the same week the year before (Springboard). It’s hard to say how quickly confidence builds from here, especially in light of an impending sharp rise in unemployment once the government’s furlough scheme comes to an end. One thing is clear though - there’s no shortage of cash right now.
The Bank of England published data last week showing the sharp increase in retail bank deposits. There’s a startling build up of saving as those with an income spent more than 100 days, with the exception of Amazon and grocery stores, with no where to spend.
Wherever you look, there’s been a significant improvement in consumers’ balance sheet in aggregate. In fact, taking both consumer and companies together, saving has been significantly higher than borrowing for some weeks.
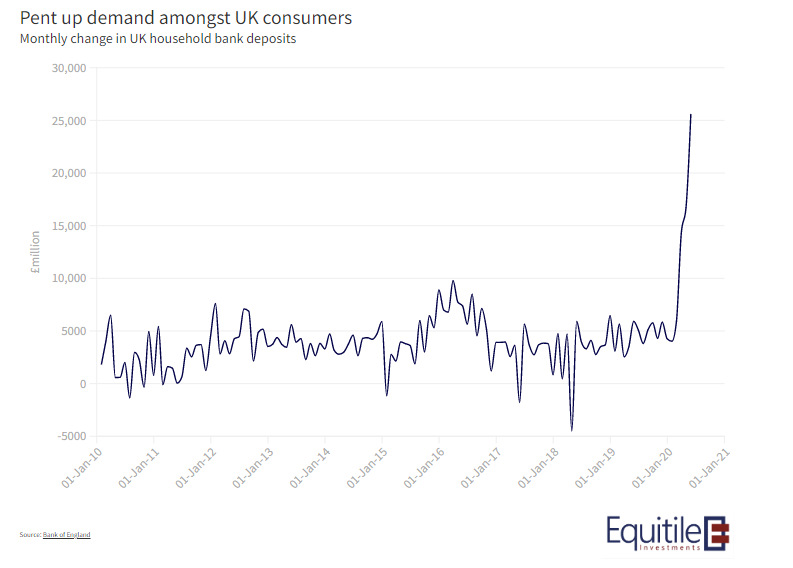
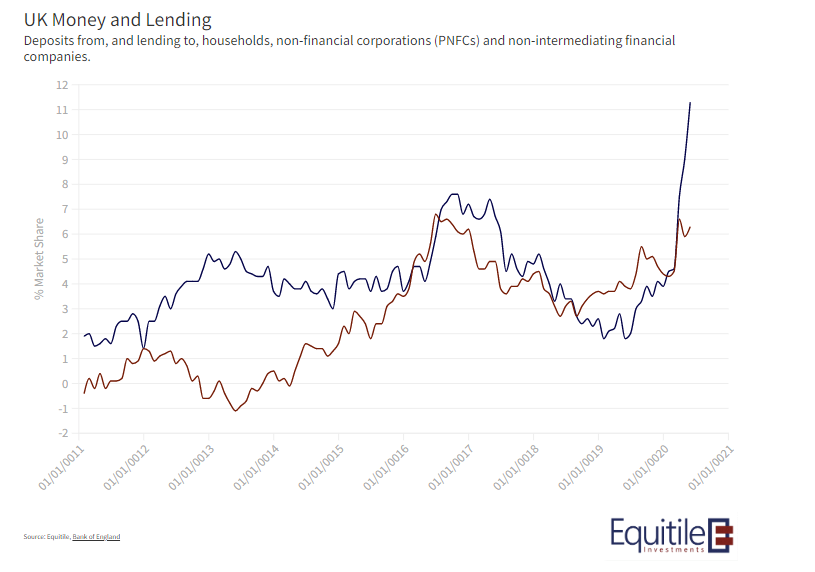
It can’t go on forever of course, Keynes’ so-called Paradox of Thrift can soon take hold. For now though, those left with an income have plenty of financial capacity to fulfil their pent-up demand.
30th November 2019

I have been asked to re-post four articles origionally written in April/May 2014 about the ideas of Thomas Piketty in his book Capital in the Twenty First Century: The Magical Mathematics of Mr Piketty Part 1 and Part 2, Credit in the Twenty First Century and The Horrible History of Mr Piketty
----------------------
The Magical Mathematics of Mr Piketty Part 1
To my mind the best quote from Thomas Piketty’s new book Capital in the Twenty-First Century is: “To put it bluntly, the discipline of economics has yet to get over its childish passion for mathematics…” p32
I could not agree more. But this does not mean we should dispense with mathematics entirely. Some problems in economics are easily formulated in mathematics, for those the equations can be a useful tool to test the validity of the underlying logic. This is true for the ideas in Piketty’s own book.
There are only three important mathematical relationships in Piketty’s book but I am having trouble reconciling them, especially in the low growth world that Piketty wants to analyse.
The three relationships are:
“This fundamental inequality, which I will write as r > g (where r stands for the average annual rate of return on capital, including profits, dividends, interest, rents, and other income from capital, expressed as a percentage of its total value, and g stands for the rate of growth of the economy, that is the annual increase in income or output), will play a crucial role in this book. In a sense, it sums up the overall logic of my conclusions.”
r > g
“I can now present the first fundamental law of capitalism, which links the capital stock to the flow of income from capital. The capital/income ratio β is related in a simple way to the share of income from capital in national income, denoted α. The formula is
α = r × β
Where r is the rate of return on capital.
For example, if β=600% and r = 5%, then α = r × β = 30%.
In other words, if national wealth represents the equivalent of six years of national income, and the rate of return on capital is 5 percent per year, then capital’s share in national income is 30 percent.”
“In the long run, the capital/income ratio β is related in a simple and transparent way to the savings rate s and the growth rate g according to the following formula:
β = s / g
For example, if s = 12% and g = 2%, then β = s/g = 600%.
In other words, if a country saves 12 percent of its national income every year, and the rate of growth of its national income is 2 percent per year, then in the long run the capital/income ratio will be equal to 600 percent: the country will have accumulated capital worth six years of national income.”
In summary the three key relationships in Piketty’s mathematical framework are:
The inequality r > g
The first fundamental law of capitalism: α = r × β
The second fundamental law of capitalism: β = s/g
Of these Piketty’s inequality has captured most attention. Piketty is at pains to emphasise that, r, the return on capital is always greater than, g, the growth rate of the economy. He also maintains that r is more or less a constant at around 4 to 5% and he expects growth to head lower toward around 1 to 1.5%.
We can explore what happens to these relationships as the rate of economic growth falls toward zero.
To keep the examples simple I will assume a constant return on capital of 5% and a constant savings ratio of 10%. This leaves the growth rate, g, as the only free variable in the system.
The following table shows the key variables under different growth scenarios.
| Growth rate | g | 4% | 2% | 1% | 0.50% | 0.25% | 0.125% |
| Savings Rate | s | 10% | 10% | 10% | 10% | 10% | 10% |
| Return on Capital | r | 5% | 5% | 5% | 5% | 5% | 5% |
| Capital/Income ratio | s/g | 2.5 | 5 | 10 | 20 | 40 | 80 |
| Share of national income going to owners of capital | r x(s/g) | 12.5% | 25.0% | 50.0% | 100.0% | 200.0% | 400.0% |
| Share of national income going to workers | 1-r x(s/g) | 87.5% | 75.0% | 50.0% | 0.0% | -100.0% | -300.0% |
As growth falls capital values rise pushing up the share of national income accruing to the owners of capital – one of Piketty’s key concerns. However as growth falls toward zero it becomes apparent that all is not well in this model. The capital/income ratio eventually rises to a point where more than 100% of the national income goes to the owners of capital - clearly an impossible scenario.
The problem arises because Piketty’s second ‘fundamental’ law of capitalism β=s/g contains a singularity , a divide by zero, which sends the value of capital toward infinity as the economy stagnates. When coupled with Piketty’s assertion that the return on capital remains above g, at around 4 to 5%, this sends the income from capital to infinity – another impossibility
Piketty’s equations simply cannot hold true in the low growth environment which he is trying to analyse.
The question is how to fix them. The most logical approach is to accept that the yields on assets fluctuate to reflect the growth rate of the economy. If growth is cut in half then asset prices will double but their yields will also be cut in half, a condition met when r = g.
If the scenarios are re-run with r = g we get the following results shown in the table below.
If we accept that the real return on assets floats with growth, r = g not, as Piketty claims, r > g, then there is no conflict with either of Piketty’s two fundamental laws of capitalism.
I expect the r = g assumption will make more intuitive sense to investors who have seen the real yields on, for example, inflation protected bonds collapse as growth has fallen. It also helps explain why pension funds are struggling to meet their funding targets and why the UK government has recently relaxed the requirement for pensioners to buy annuities – because annuity yields have fallen in line with economic growth.
However the r = g assumption causes a significant issue for Piketty’s case for a wealth tax. If r = g prevails in a low growth world then Piketty’s 2% wealth tax could push the return on capital into negative territory potentially crushing entrepreneurial activity.
In conclusion – Piketty’s own fundamental laws of capitalism appear at odds with the inequality on which much of his book is based. This is especially true in the low growth world he is concerned about.
| Growth rate | g | 4% | 2% | 1% | 0.50% | 0.25% | 0.125% |
| Savings Rate | s | 10% | 10% | 10% | 10% | 10% | 10% |
| Return on Capital | r=g | 4% | 2% | 1% | 1% | 0.25% | 0.125% |
| Capital/Income ratio | s/g | 2.5 | 5 | 10 | 20 | 40 | 80 |
| Share of national income going to owners of capital | r x(s/g) | 10.0% | 10.0% | 10.0% | 10.0% | 10.0% | 10.0% |
| Share of national income going to workers | 1-r x(s/g) | 90.0% | 90.0% | 90.0% | 90.0% | 90.0% | 90.0% |